
Data is the new oil
We keep hearing that and saying that in business circles. The biggest companies in the world these days certainly have maximized their use of data — both consumer-level and organizationally — to excel financially and grow. Data is crucial, and everyone is looking for competitive advantages within it. It begs the question, then: in call and contact centers, what metrics tend to matter the most?
A quick note on the Conectys side here: we can track all these metrics for clients, and have in many cases. We also do customized and specialized metrics dependent on your business model and specific needs.
Call center metrics to be considering
In no truly particular order:
First Contact Resolution (FCR): This is calculated by dividing the total number of calls resolved on the first attempt by either the total number of calls received or the total number of initial calls. It speaks directly to customer experience because customers become frustrated if they have to repeatedly call to resolve a problem. The higher the FCR, the better the CX tends to be, which drives loyalty.
Net Promoter Score (NPS): To calculate, you start with the question: “How likely is it that you would recommend [company X] to a friend or colleague?”
Customers respond using a 0-10 rating scale, with responses grouped into three categories:
- Promoters (9-10)
- Passives (7-8)
- Detractors (0-6)
Take the percentage of 9/10 scores and subtract the percentage of 0-6 scores. That’s your NPS.
In contact centers, anything above 40-45 is considered very strong. Into the 60s, 70s, and 80s is elite.
Customer Effort Score (CES): As seen here, look at this example from Gartner:
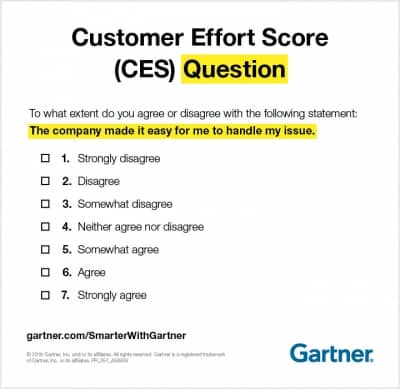
Take the percentage of “Agree” and subtract the percentage of “Disagree” and that’s your CES.
Customer Satisfaction (CSAT): On 1-5 score surveys, take the number of 4 and 5 scores — satisfied customers — and divide by the total number of responses, then multiply by 100. For example, if you collect 20 responses, and 10 people give a 4 or 5 score, that’s 10 divided by 20, or ½. Multiply by 100 and you get a CSAT of 50, which is OK but could be better.
Average call abandonment rate (CAR, sometimes): Customers don’t like being on hold, and this is a measure of what happens when they are. You take the number of total calls offered — let’s say 100 to be easy — and subtract the number of calls handled. Let’s say 80 were handled. 100-80 is 20. You then divide by the number of calls offered (100) and get 20/100, or ⅕. The call abandonment rate was thus 20%. When this goes too high, customers are frustrated, and brand equity can suffer.
Cost Per Call (CPC): This is the total cost of all calls divided by the total number of calls. It’s a good metric for line-item analysis of contact center cost-effectiveness but doesn’t give you a full picture of agent experience or CX.
Peak Hour Traffic (PHT): This allows you to understand when most calls, chats, emails, etc. come in, so it’s an important staffing metric.
Percentage of calls by type: Usually the tracked types are:
- Order Taking/Tracking
- Questions and Inquiries
- Customer Support
- Complaints
- Inbound Call Redirects
Others can fit in here too, tho.
Agent Utilization Rate (AUR): It looks like this, mathematically:
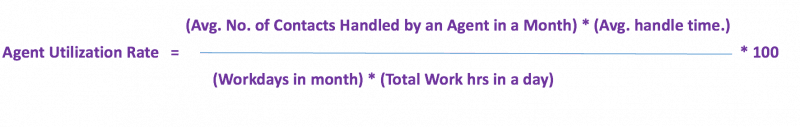
Six working hours of an eight-hour day would be a 75% utilization rate. This is a good metric for seeing the type of productivity you’re getting from agents. It’s not holistic, but it’s something to look at.
Average Speed of Answer (ASA): This is the total waiting time for answered calls divided by the total number of answered calls. When this metric is too high, it can mean that agents are taking too long on calls—or taking too much time to pick up new calls.
Average Handle Time (AHT): Looks like this:

When you see agents who routinely exceed this threshold, you may need to determine if they have all the skills and tools they need. By contrast, if agents are far below this benchmark, they may be rushing through calls and not addressing customer issues completely.
Transfer Rate: This is the number of calls transferred divided by the total number of handled calls. Some transfers are inevitable, but in general, you want this to be a low number, because customers don’t like getting shuttled between agents and departments, with the possible exception of escalation to a manager (which you should also aim to keep low).
Others: Let us know what call center and contact center metrics we might have missed. If you have questions about running contact centers and what metrics make the most sense for your business, don’t hesitate to reach out!
Check also, how to measure customer success.